Case study Dashboard Usage
User research to check if the tools were used how we intended them to be used.
- Year
- 2021-2022
- Role
- UX Researcher
- Client
- KLM Engineering and Maintenance
- Skills
- Usability research
Project Overview
Problem
The KLM Engineering and Maintenance (E&M) - Component Services (CS) Business Intelligence (BI) team built a dashboard for the business to see the performance of the whole supply chain.
Because of the scale of the project, as the user base kept growing, we wanted to examine if the dashboard was used for its intended purpose.
Objective
What I wanted to research is how it is being used by a specific business unit; Component Repair. Their section of the dashboard was most developed, and I wanted to test how it's being used by these users.
Additionally, when developing, we designed with a philosophy of how we would like it to be used. I also wanted to test if this use case was true. We got some suspicions that it might not be used how we intended.
The last thing I wanted to research was if the knowledge about the dashboard was similar between all users. In earlier meetings, it sometimes came up that some users were using the dashboard less than others. So maybe this was because of knowledge?
Research Methodology
I used the field research methodology Contextual Inquiry. This seemed to be the best method in my opinion, because I wanted to see how the users used our product in their natural habitat.
What is Contextual Inquiry
According to NNgroup, Contextual Inquiry is as follows:
Contextual inquiry is a type of ethnographic field study that involves in-depth observation and interviews of a small sample of users to gain a robust understanding of work practices and behaviors.
More information can be found here: https://www.nngroup.com/articles/contextual-inquiry/
Participants
I conducted this research on all the Shop Leads from the department Component Repair. These are the hierarchical managers of the repair shops that repair our Airplane Components.
The KPI Dashboard is a management-level dashboard where week-by-week trends can be viewed in addition to daily updates.
How the Research Was Conducted
As described prior, I used Contextual Inquiry to conduct my research. How this looked like in practice is I scheduled 1-on-1 meetings with each shop lead to watch how they used the dashboard. Afterwards, there was an interview based on what I observed.
What I learned while doing this is that my research methodology changed a bit. How in the beginning it was more just watching and (screen) recording how they used the dashboard, it turned more into a short demo on how they use it and a longer interview.
"I don't know why I need to click here, it does not make that much sense, but it was explained like this to me."
Key Findings
Positive Findings
The demos the shop leads gave me were all around 5 minutes; they could very easily show me how they use it, even if the knowledge between users was so varied. But all users used the dashboard as intended and could find the most important data they needed.
Pain Points
Reliability: Because of technical limitations, the dashboard encounters a lot of outages where the dashboard data is not updated at the expected time. This makes the dashboard unreliable.
There was a problem with "on hold" orders where, because of different processes between shops, some shops can use it but others cannot. Especially the Seats shop encounters problems with this.
Unexpected Insights
Knowledge of how the dashboard works is really varied. Some users know it through and through, some have hardly used it at all.
The structure of the collaboration with the Shop Leads was that there is one contact person, and this person would communicate all problems to us and all changes to the other shop leads. This ended up not happening. So some users would be confused by changes because they were not brought up to speed.
Design Recommendations
Solutions to Address Pain Points
The three most important pain points I found were: knowledge between users, reliability of data, and communication between users.
Solutions to Solve User Knowledge
Trainings for the users that are less familiar with the dashboard. In this training, we would go through the product, and they could ask questions so they would leave with all the information they need.
The training would be only done once to get everyone up to speed, so in addition, we are thinking about creating manuals and/or demonstration videos to explain the basics. This could also serve as a reference if they forgot something.
Solutions for Reliability
A commitment from us that every Monday the dashboard is updated with correct data so they can start the week fresh. Our tech stack has the most issues during the weekend, so we commit to drop everything to fix it on Monday morning.
The dashboard will get a label showing when the data was last loaded. With this, the users can easily check when the data is loaded. The label also shows when the backend will try to reload the data again.
In addition, we also built an automatic email to notify us when the data is not updated so we can take quick action.
Solutions for Communication
Instead of relying on the trickle-down communication, we want to set up a "CSBI Customer Portal" where users can find all kinds of information about us. The portal will contain:
- Links to all our dashboards
- Notifications about our products
- Manuals and instructional material
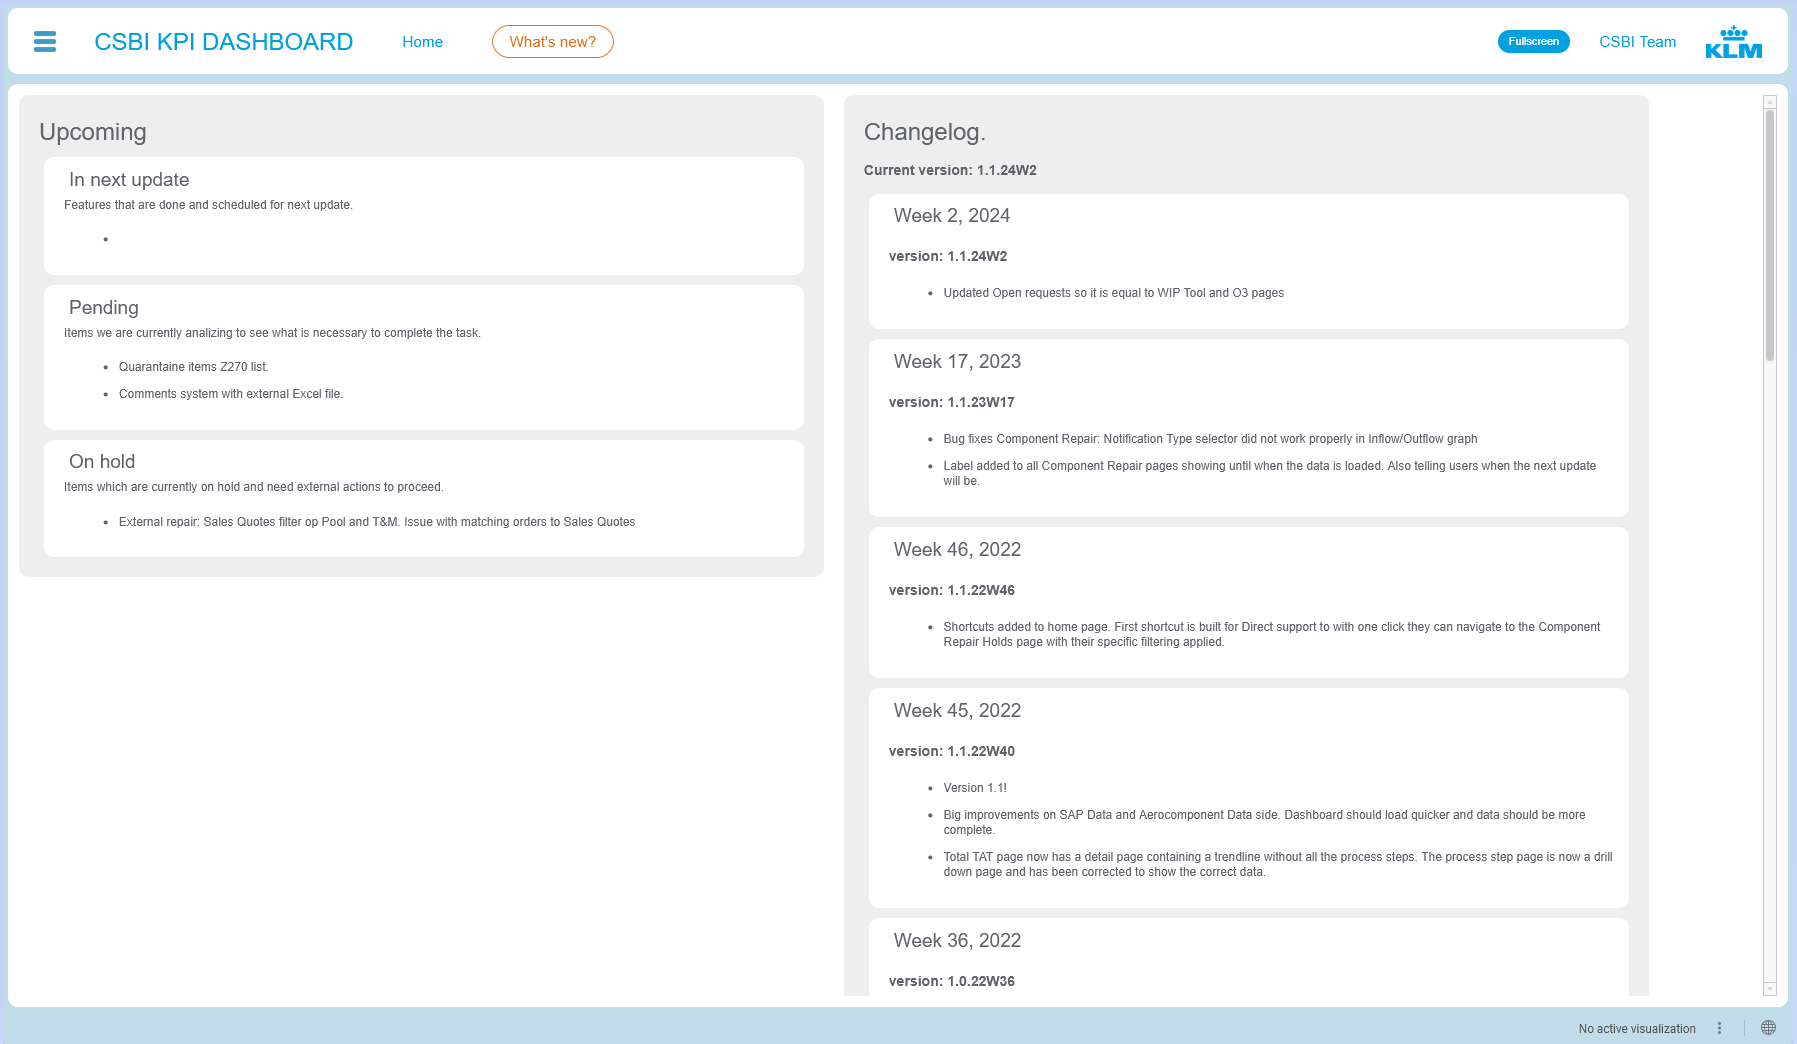
In addition to the before mentioned points we also added a "What's new" page to communicate new features and bug fixes.
Prioritization of Changes
- First, we need to improve the reliability. This is also about the reputation of our team. The data needs to be correct and updated when they need it.
- Second is getting all users up to speed with how the dashboard works. We will start scheduling training sessions and start creating instructional materials.
- Lastly, we will improve communication by creating the Customer Portal with all the information. We put this last because it will take the most time to complete.
Reflections and Learnings
This user research project was very instructive for me as this was the first time I got the opportunity to do something like this within KLM.
One thing that was unexpected is that over time I changed the research methodology slightly. It started strictly just watching how they worked with the dashboard and asking questions on the actions they take. But over time it turned more into an interview that went wider than just the use of the dashboard. I also got to know what the data was used for and how their performance meeting looks like.